
A home energy audit shows where you’re losing heat, how much you’ll save from targeted upgrades, and the steps to turn findings into a budget-smart plan. Expect blower-door tests to reveal leaks, infrared scans for comfort and safety gaps, and a clear ROI plus comfort gains for each fix. Use these metrics to rank projects by payoff—high-ROI first, then comfort and safety. If you keep going, you’ll learn how to prioritize and implement these upgrades effectively.
What an Energy Audit Covers (Foundational Overview)
An energy audit examines how your home uses energy, where it’s wasted, and what you can change to cut bills. You’ll see a foundational overview that maps energy flows, major loads, and usage patterns, so you know what to fix first. Expect a clear list of components inspected and measured, plus practical next steps you can take today.
The report highlights thermal insulation needs to reduce heat transfer and lower cooling loads, along with ventilation strategies to maintain comfortable, healthy indoor air. You’ll learn how envelope conditions, equipment efficiency, and occupancy behavior influence performance.
Action items are prioritized by impact and cost, with quantified savings and simple implementation steps. This foundation empowers targeted improvements, guiding you to higher comfort, lower bills, and informed budgeting decisions.
How Blower Door Tests Reveal Leaks
Blower door tests measure how easily air moves through your home, revealing leaks that standard checks miss. You’ll learn the basics of the blower door setup and how pressure differences pinpoint gaps in walls, ceilings, and around fixtures.
Use these findings to target sealing efforts, reducing drafts and improving efficiency.
Blower Door Basics
Ever wonder how a blower door test reveals hidden leaks? You’ll understand the basics by watching air movement under controlled pressure differences. A calibrated fan mounts in a main exterior door, creating a slight positive or negative pressure inside the building.
The test measures how much air must flow to maintain that pressure, revealing air leakage paths. You’ll note depressurization or pressurization rates, expressed as air changes per hour at 50 Pa (ACH50) or similar metrics.
Expect quick, repeatable results that pinpoint weak spots—doors, windows, penetrations, and ducts—without guesswork. Use the data to prioritize sealing tasks: gasket upgrades, weatherstripping, canister vents, and targeted insulation.
The goal is durable comfort, reduced drafts, and lower utility bills.
Detecting Air Leaks
What leaks into your home, and where they hide, becomes obvious once you run a blower door test. You’ll see pressure differences reveal gaps, cracks, and openings that escape the eye. Use the results to map leak sources and prioritize fixes, not guesswork.
As you review the report, focus on sections that discuss drafting insulation and sealing methods, then translate findings into actionable steps.
- Identify continuous gaps around doors, windows, and cabinets, and quantify their size for targeted sealing.
- Distinguish between penetrations (pipes, wires) and envelope flaws to guide drafting insulation strategies.
- Pair leak fixes with efficient sealing methods that work with your climate and budget, then re-test to validate improvements.
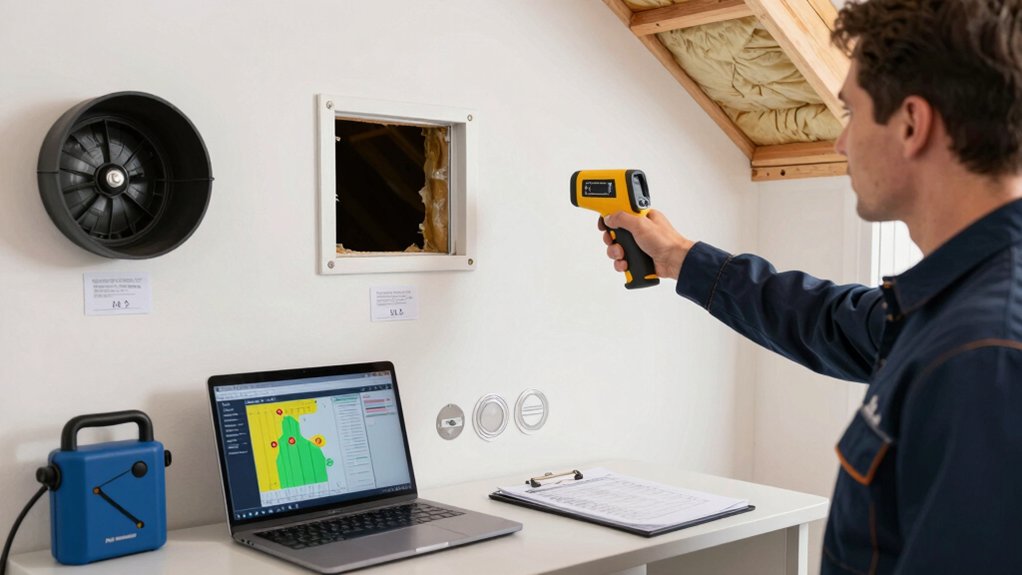
Reading Infrared Scans for Comfort and Safety
Infrared scans show more than just warm and cool patches—they reveal heat flow patterns that affect comfort and safety. You’ll use infrared imaging to identify insulation gaps, duct leaks, and thermal bridges that drive drafts and uneven temperatures.
Focus on persistent cold spots in winter and unexpected warm areas in summer, which signal inefficiencies or moisture risks. In a safety inspection, look for electrical panel hotspots, recessed lighting enclosures, and outlet wiring Archetypes that may indicate overloads or arcing potential.
Correlate findings with visible signs like staining or frost to confirm moisture or insulation failures. Document locations, approximate temperatures, and affected zones, then prioritize fixes by impact on comfort first, safety second, and retrofit feasibility third.
Use results to guide targeted repairs and verify improvements after remediation.
Key Metrics You’ll See (Before/After ROI and Comfort Gains)

You’ll see ROI shifts before and after upgrades, so you can quantify improvements side by side with upfront costs.
Track comfort gains like draft reduction and temperature stability, and link them to measurable energy savings over time.
This timeline helps you prioritize investments and forecast payback with confidence.
ROI Shifts Before/After
ROI shifts after an audit show where dollars and comfort meet. Before you act, you’ll see a side‑by‑side cost analysis and ROI comparison that reveals which improvements deliver the fastest payback and the biggest comfort gains.
After implementing recommended projects, the report highlights how those same upgrades perform in real life, not just on paper. You’ll use the before/after contrast to prioritize actions with the strongest financial and experiential impact, guiding budget and scheduling decisions.
- Compare pre‑ vs post‑audit costs and savings to quantify payback
- Assess comfort improvements alongside energy reductions for a holistic view
- Align project timing with ROI peaks to maximize return on investment
Comfort Gains Metrics
Comfort gains come first in the before/after ROI story. In this section, you’ll quantify how comfort improves with each improvement, not just dollars saved. Expect metrics like indoor temperature stability, reduced drafts, and fewer hot or cold spots across rooms.
You’ll see how HVAC efficiency translates into steadier comfort during peak loads, minimizing swings that disrupt daily living. Before you implement, baseline readings capture typical comfort complaints and occupancy patterns. After, compare changes and attribute gains to specific upgrades.
Insulation upgrades play a critical role by dampening humidity and temperature gradients, making moments of occupancy more predictable. Use these metrics to prioritize projects that deliver tangible comfort, then validate ROI with follow-up measurements to confirm lasting impact on daily living.
Energy Savings Timeline
Energy savings unfold over time, so you’ll track a clear before/after path that ties cost reductions to real-world performance. In this timeline, you’ll see ROI emerge as equipment upgrades, insulation, and smarter controls reduce energy use during peak windows, while you’ll measure comfort gains alongside savings.
Expect incremental boosts in indoor air quality and system responsiveness as renewable integration optimizes generation/consumption cycles. The key metrics show payback periods, cumulative savings, and relative comfort improvements, helping you prioritize work that compounds over months to years.
- Before/after ROI milestones aligned with project scopes and seasonality
- Comfort correlations tied to system tuning, indoor air, and ventilation
- Renewable integration impact on demand, cost, and payback timeline
Prioritizing Upgrades by ROI, Comfort, and Safety
When deciding which upgrades to tackle first, prioritize based on ROI, comfort, and safety to maximize value and impact. You’ll assess each project by three lenses: payback period, measurable comfort gains, and risk reduction.
Begin with high-ROI improvements that also enhance daily living, such as insulation upgrades that lower heating costs and stabilize temperatures. Pair these with ventilation improvements to improve air quality and prevent moisture damage.
Then address comfort-driven wins, like tighter envelopes and efficient heating controls, which reduce drafts and cold spots.
Finally, evaluate safety-linked updates—smoke/CO detectors, electrical updates, and moisture control in kitchens and baths.
Create a ranked list, factor annual energy savings, upfront costs, and disruption, and sequence work to align with budget cycles and weather.
Common Upgrade Pathways by Payback and Impact

To map upgrades by payback and impact, start with high-ROI improvements that also boost daily comfort and health. You’ll want bets that cut energy use without sacrificing usability, then layer in longer-term gains.
Prioritize insulation upgrades to reduce heat loss in winter and heat gain in summer, lowering both comfort swings and utility bills. Pair this with appliance efficiency upgrades to shrink standby and running costs while maintaining performance.
This approach yields quick payback while enhancing day-to-day living, and it sets the stage for deeper retrofits later.
- Insulation upgrades to walls, attic, and ducts for consistent temps and lower heating/cooling loads
- Appliance efficiency improvements (refrigerators, washers, HVAC) to reduce runtime and energy waste
- HVAC system tuning and air-sealing to optimize comfort with minimum energy input
Create a Budget-Smart Action Plan
Design a budget-smart action plan by prioritizing doable, high-impact upgrades within your financial means, then map them to a 12- to 36-month timeline. You’ll start with a clear list of feasible projects, ranked by impact and cost, then attach concrete milestones and dates.
Use budget planning to quantify each item’s upfront cost, ongoing savings, and expected payback, creating a transparent cash-flow picture.
Perform a cost analysis to compare alternatives, selecting options that maximize return within your constraints. Build in contingency for price changes and supply delays.
Document who approves each step, and when. Establish a monitoring cadence to track savings vs. projections, and adjust timelines as needed.
This plan guides execution, eliminates guesswork, and keeps you accountable to results.
Real-World Examples: Typical Improvements That Pay Off
You’ll see real-world retrofit wins that save money quickly, like better insulation, LED lighting, and efficient HVAC upgrades.
These moves typically deliver clear payback, so you can prioritize fixes with the strongest energy-per-dollar impact.
Start with proven examples and measure the results to refine your plan.
Typical Payback Wins
What typical payback wins actually look like? You’ll see clear, real-world examples where energy efficiency translates to fast financial gains and measurable comfort improvements. Focus on projects with solid upfront value, quick returns, and predictable performance, so you maximize cost savings without overhauling your systems.
By prioritizing proven measures, you’ll reduce utility spend while preserving indoor quality and reliability.
- Seal air leaks and improve insulation for immediate comfort and lower heating and cooling costs
- Upgrade to high-efficiency equipment or thermostats to cut ongoing energy use and boost system responsiveness
- Optimize ventilation and moisture management to protect assets and maintain consistent conditions
These wins demonstrate how strategic changes deliver tangible energy efficiency, lower bills, and meaningful payback timelines.
Real-World Retrofit Examples
Real-world retrofit examples show how proven improvements translate into real savings. You’ll notice that small, focused upgrades outperform broad, unfocused projects.
Start with insulation installation in the attic or walls where heat loss is highest; these fixes reduce heating and cooling loads and stabilize interior comfort. Combine this with duct sealing to stop air leaks along the delivery path, often delivering immediate gains in furnace efficiency and thermostat responsiveness.
You should verify the impact with a before-and-after bill or a quick blower-door test if available. Prioritize projects that align with your climate and existing equipment.
Track payback, then reallocate savings to higher-value tasks, like upgrading to high-efficiency equipment or adding smart controls for ongoing energy discipline.
Compare Contractors and Materials Using Your Audit
To compare contractors and materials using your audit, start by aligning each option with the specific efficiency opportunities your findings highlight.
Then evaluate track record, warranties, and supplier reliability against the anticipated energy savings and payback.
Use your data to prioritize contractor quality and material performance over price alone, focusing on long-term value.
Ask for calibration methods, testing results, and documentation of attic, wall, or duct improvements that match identified leaks or inefficiencies.
Compare installation timelines and disruption, ensuring crew competence aligns with required measures.
Finally, request transparent cost breakdowns, including potential retrofit rebates and maintenance needs, to inform a contractor comparison and material selection that maximize your audit’s recommended actions.
- Evaluate track records, warranties, and reliability aligned to energy savings
- Verify calibration, testing results, and documentation matching identified inefficiencies
- Request transparent cost breakdowns, rebates, and maintenance needs
Turn Findings Into Maintenance and Prevention Habits
By turning your audit findings into concrete routines, you’ll prevent energy losses before they recur and extend equipment life. Turn insights into daily actions by codifying maintenance habits that target high-impact systems first. Schedule simple, repeatable checks—door seals, insulation gaps, thermostat calibration, and filter changes—and set clear owners and frequencies.
Document results, so you can track trends and adjust as needed. Pair every task with a purpose: reduce drafts, improve airflow, or curb standby losses. Integrate preventive steps into your regular home routines, not as chores, but as ongoing upkeep.
Use these prevention strategies to avoid costly surprises and maintain peak efficiency. Review quarterly, refine protocols, and celebrate steady, measurable gains.
Conclusion
You’ve got the data, now act. Use your audit to rank fixes by ROI, comfort, and safety, then lock in a realistic timeline and budget. Prioritize air leaks, insulation gaps, and efficient upgrades that boost comfort without breaking the bank. Schedule contractor comparisons, verify materials, and set measurable targets for before/after gains. Track progress like a pro—maintain routines, recheck seals, and revisit the report quarterly. Now reboot your home, Marty McFly–style, into a leaner, smarter energy future.