
Working with a touch of diplomacy, you’ll weigh upfront costs against long-term gains when considering solar panels. You’ll see that equipment, installation, permits, and site work matter now, but energy savings, higher resale value, and incentives shape the payoff later. The math changes with financing, rate plans, and tax credits, so you’ll need a framework to compare scenarios. If precision and practicality matter, you’ll want the full picture before you decide what comes next.
Understanding the Solar Cost vs Value Decision
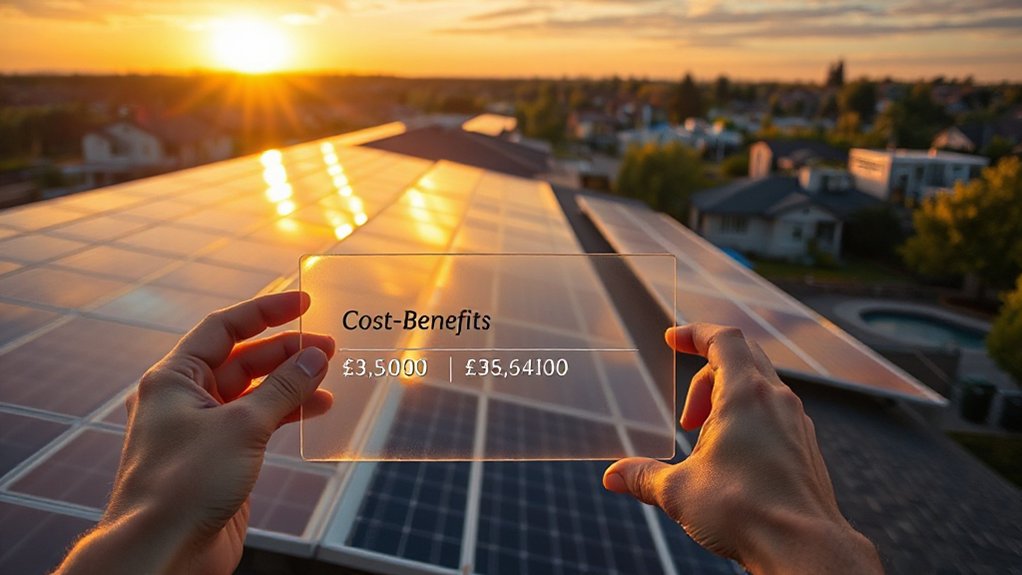
Installing solar is a cost-versus-value decision rooted in data, not expectations. You’ll compare upfront costs, ongoing savings, and payback timelines using transparent inputs like system size, local utility rates, and financing terms.
Solar panel materials influence efficiency, durability, and warranty posture, so you’ll weigh performance curves against module quality and degradation rates.
Installation safety remains non-negotiable: design choices, mounting methods, and interconnection steps affect risk, permit timelines, and insurance implications.
You’ll quantify incentives, net metering impact, and maintenance needs to derive a breakeven horizon tailored to your usage pattern.
Data-driven decisions reduce uncertainty, enabling you to separate hype from value.
In practice, model scenarios, stress-test assumptions, and document the margin of error to support a rational, objective conclusion.
How Solar Adds Long-Term Home Value
Solar panels generally boost home value through proven, measurable channels that buyers recognize. You’ll see value in energy cost savings, market appeal, and appraisal adjustment, supported by recent data on efficiency and system age.
In practice, long-term value comes from predictable savings, lower operating costs, and extended system life with maintenance. Consider these mechanisms:
1) Energy bill reductions that persist over decades, improving affordability without eroding resale price.
2) Market differentiation as homes with renewables attract buyers seeking reliability and sustainability.
3) Compliance and incentives that can influence appraisal baselines and tax considerations, aligning with evolving standards.
Sustainable Landscaping and Solar Panel Recycling influence desirability by framing a holistic, eco-friendly home profile, signaling responsible ownership and future-proofing.
What Upfront Solar Costs Include
Understanding upfront solar costs starts with a clear breakdown of what you’re paying for beyond the panels themselves: equipment, installation labor, permitting and inspection fees, and any site-specific work.
You’ll assess hardware components (inverters, racking, wiring), then recognize labor hours, project management, and potential scaffold or roof-access needs.
Permits and utility interconnection steps add time and cost, while site-specific tasks—like electrical upgrades or structural reinforcements—drive variability.
Consider solar financing options that affect upfront burden and long-term payments, and account for maintenance costs that begin after installation, such as inverter replacements and periodic inspections.
This framework helps you quantify the true upfront outlay and compare bids with a consistent lens, aligning immediate expenditure with expected performance and durability.
How Incentives and Tax Credits Change the Math

Incentives shorten your payback period by boosting early savings, so you’ll see a faster capital recovery when incentives are available.
Tax credits reduce your net upfront and ongoing costs, making the project appear more favorable on a net-present-value basis.
Policy timing matters, since shifts in incentives or eligibility windows can alter ROI projections and decision timing.
Incentives Affect Payback Period
Tax credits and incentives directly shorten the payback period by cutting upfront costs or raising the system’s net value, which makes the math of solar more favorable for many homeowners.
You’ll see three core effects on payback:
1) Reduced initial outlay boosts early-month cash flow and shortens the recovery horizon.
2) Post-install incentives raise annual net savings, improving the internal rate of return.
3) Seasonal and utility-rate variations amplify value when incentives align with peak production.
Consider sensitivity to solar panel materials and installation challenges, as these influence cost baselines and warranty protections, shaping ultimate payback.
In practice, model scenarios with and without incentives to reveal true net benefits, rather than rely on headline figures. This disciplined approach keeps estimates precise and decisions grounded.
Tax Credits Reduce Net Cost
When you factor in incentives and tax credits, the net cost of a solar system drops in clear, quantifiable ways. Federal tax credits, state programs, and utility rebates reduce upfront outlays, often offsetting a large portion of equipment and labor.
You’ll see the biggest impact when you align eligible components with remaining credit values, which makes material costs more influential in the overall math. Because credits typically apply to solar panel materials and installation techniques that meet program rules, you can model net cost with a simple equation: gross price minus credits equals net investment.
Your selection of modules and inverters, plus efficient mounting and commissioning, shapes both initial expense and credit eligibility. In practice, precise budgeting relies on verifiable documentation and program deadlines.
Policy Timing Impacts ROI
Policy timing can swing the ROI of a solar install by accelerating or delaying when credits, rebates, and incentives actually apply, which shifts the present value of savings relative to upfront costs. You’ll see the math change as you align incentives with your cash flows, improving or eroding net payback timelines.
When incentives front-load value, the internal rate of return rises; when they shift later, it falls. Consider how solar battery and energy storage enable timing arbitrage—storing cheap or incentive-aligned generation for peak-rate periods, enhancing savings.
Here are key levers:
1) Timing of tax credits and rebates
2) Depreciation windows and grant alignments
3) Battery pairing, system life, and maintenance costs
Solar Financing Options: Loans, Leases, PPA
Solar financing options—loans, leases, and power purchase agreements (PPAs)—offer different paths to solar penetration without upfront capital. You’ll compare total lifetime costs, including interest, leasing fees, or PPA rates, against projected energy savings.
Loans let you own panels, capture incentives, and build equity, but require credit checks and monthly payments. Leases and PPAs reduce or eliminate upfront costs yet cap savings and transfer maintenance to the provider.
If you value predictability, a fixed-rate loan provides steadier hedging against rate swings; if you prefer simplicity, a PPA or lease may suit short horizons.
Consider solar panel aesthetics when selecting mounting, color, and placement, which influence home value modestly.
For accessibility, community solar expands options for renters or those with shading, offering shared benefits without on-site arrays.
Analyze, compare, and align with your cash flow and goals.
Ongoing Maintenance and Performance Costs
Ongoing maintenance costs, including routine inspections and minor part replacements, typically add a predictable annual expense that you can model against system output.
Performance degradation factors—like panel aging, soiling, and potential inverter wear—gradually reduce efficiency and should be factored into long-term energy yield projections.
Establishing a regular cleaning and upkeep schedule helps sustain performance and prevent avoidable losses, making cost estimates more accurate over the system’s lifetime.
Ongoing Maintenance Costs
Maintaining solar PV systems incurs regular, predictable costs that can influence overall cost-effectiveness, even as the technology benefits from long-term reliability. You’ll see modest annual expenses tied to inspection, cleaning, and minor component upkeep, typically outweighing major repairs. To stay on track, track performance data and align maintenance with manufacturer guidance.
- Inspect inverters, wiring, and mounting for corrosion or wear, at least annually.
- Schedule periodic cleaning and debris removal to sustain peak efficiency.
- Review warranties and service agreements, ensuring coverage aligns with solar panel warranties and installation permits.
Data-driven decisions favor preventive steps over reactive fixes, preserving output and system value. Expect costs to be predictable, with bulk savings from bundled service plans.
Performance Degradation Factors
Have you considered how performance degrades over time and what that means for ongoing maintenance costs? In this section, you evaluate degradation rates for common solar panel materials and how installation techniques influence them.
Data show that crystalline silicon modules typically lose 0.5–1% efficiency per year, with variation by quality and operating temperature. Thin-film options may degrade faster or slower depending on composition and environmental exposure.
Temperature, UV exposure, and soiling interact with electrical design, affecting net output and replacement assumptions. Maintenance costs rise as cells lose efficiency, connectors age, and encapsulants weather.
Proper installation techniques minimize microcracking, shading losses, and moisture ingress, extending useful life and stabilizing performance curves.
Use these inputs to forecast levelized costs and value retention over 20–25 years.
Cleaning And Upkeep Schedule
How often should you clean and inspect your solar array to protect performance and control costs? Regular upkeep minimizes efficiency losses and extended downtime, weighing maintenance against energy gains.
Clean when dust or pollen buildup reduces output by measurable margins, using gentle methods to avoid panel damage. Inspect mounts, wiring, and drainage to prevent corrosion and microcracking, and verify inverter data for anomalies.
Consistent records help benchmark performance versus environmental impact and industry norms, guiding cost-effective decisions.
- Schedule semiannual inspections and post-storm cleanups to sustain solar panel aesthetics and reliability.
- Use low-pressure water and soft brushes, avoiding harsh chemicals that could affect efficiency.
- Track month-over-month output, noting deviations and adjusting maintenance frequency accordingly.
System Lifespan and Degradation Expectations
System durability varies with panel quality, installation method, and electrical design, but most residential modules target 25 to 30 years of meaningful output. Over that period, degradation rate—often around 0.5% to 1% annually—erodes nameplate efficiency, reducing annual energy production unless compensated by savings or efficiency upgrades.
Warranty terms influence reliability: linear or pro‑rated coverage can mitigate risk of gradual output loss. Consider panel efficiency at purchase, temperature coefficients, and inverter lifecycles, since inverters frequently limit practical system life.
You’ll optimize lifetime economics by aligning degradation expectations with anticipated energy needs, maintenance capability, and financing horizon. Avoid overly optimistic projections; document assumptions transparently.
Location Matters: Sun, Climate, and Roof Orientation
Your system’s long‑term value hinges on where you install it. Location drives output, reliability, and payback, not just installed capacity. You’ll want to weigh sun exposure, climate patterns, and roof orientation to optimize performance and ROI.
- Sun exposure: panels perform best with consistent, unobstructed sunlight, ideally totaling high annual irradiance.
- Climate: dry, temperate, or cool regions can improve efficiency and seasonal output relative to hot, humid zones.
- Roof orientation: in the northern hemisphere, south‑facing roofs yield the strongest year‑round generation, with east/west alternatives offering balanced daily output.
Consider shading risk, orientation consistency, and local weather variability to forecast energy production. Data‑driven estimates reduce overconfidence and support prudent investment decisions.
Designing Your System: Sizing, Angles, and Shading
Designing your system hinges on precise sizing, ideal angles, and minimizing shading. You’ll base size on historical usage patterns, then verify with seasonal production models to avoid over- or under-sizing.
Angles should reflect your latitude and seasonal tilt, with adjustments for shading windows during midday and afternoon sun. Data shows that even small misalignments can cut output by several percent; modeling helps quantify gains from modest tilt tweaks.
Prioritize consistent orientation, a clean array layout, and minimal shading from trees or structures. When selecting solar panel materials, consider temperature coefficients, degradation rates, and mounting compatibility for your roof type.
Also plan installation safety: fall protection, wiring standards, and access routes reduce risk and downtime while preserving performance. This temperate, evidence-driven approach centers reliability and value.
Panel Technology and Efficiency: Value Impacts
Panel technology choices directly influence value by shaping efficiency, reliability, and long-term cost. You’ll see measurable differences in output quality and system uptime, driven by module efficiency, temperature tolerance, and degradation rates.
When evaluating options, panel durability matters for lifetime performance, while inverter technology governs how effectively DC is converted to usable AC, impacting overall system yield and grid interaction.
- Compare efficiencies at standard test conditions and real-world temperature ranges, noting how margins affect annual energy production.
- Assess durability metrics, including warranty duration, salt/impact resistance, and expected degradation curves for different chemistries.
- Align inverter technology with your load profile and monitoring capabilities to maximize harvest and minimize losses during shading or voltage fluctuations.
Resilience and Utility Rate Benefits
You gain resilience through backup power and smoother operation during outages, quantified by higher uptime and reduced disruption costs.
Time-of-use savings shift consumption to cheaper rates, with clear impacts on monthly bills and long-term payback.
Grid reliability benefits add value by supporting local stability and minimizing revenue losses from outages, especially in high-need periods.
Resilience Through Backup Power
When the grid goes down, solar plus storage can keep essential loads running, transforming resilience from a wish into a measurable capability. You gain reliability through a solar battery and energy storage system that isolates your critical circuits during outages, while still harvesting daytime solar.
- You prioritize loads, ensuring core functions stay online until utility power returns.
- You quantify uptime benefits and backup duration with system metrics, guiding investment decisions.
- You compare costs and benefits across scenarios to assess resilience value per dollar.
Data show outages are unpredictable, but battery-backed solar minimizes downtime and restoration time. Energy storage enables self-sufficiency in emergencies, reduces outage-related damages, and supports critical facility operations. The result is a pragmatic resilience enhancement, with clear, measurable performance targets and a tighter link between investment and recovered productivity.
Time-Of-Use Savings
Time-of-use (TOU) rates let you shift demand and consumption to cheaper, off-peak hours, revealing resilience and utility-rate benefits. With solar panels and energy storage, you can align generation with TOU windows, reducing peak-grid purchases and lowering bills.
A solar battery enables discharge during expensive periods, smoothing price volatility and improving self-consumption. Data show that TOU-aware systems cut utility charges when demand peaks, often by a few to several cents per kilowatt-hour, depending on local tariffs and容量.
Energy storage also enhances resilience by providing backup during outages, preserving critical loads without excess tax or markup exposure. In practice, quantify savings through net-present-value models that incorporate TOU spreads, battery cycles, and degradation, then verify projections with metered whole-system performance.
Grid Reliability Benefits
- Reduced outage exposure through rapid islanding and backup support
- More predictable bills via time-varying rate optimization and demand shaping
- Longer asset life with smart controls that protect equipment and defer grid upgrades
How Appraisers View Solar Installations
Appraisers treat solar installations as a factor in property value, not a stand-alone selling point. You’ll see value adjustments reflected in comparable sales analyses, where system size, age, and warranties influence adjustments rather than predict final price alone.
Data-driven methods favor verifiable metrics: production capacity, offset credits, and remaining system life drive adjustments more than aesthetics. In markets with Energy storage adoption, you’ll note higher value tied to storage capabilities and reliability, especially when paired with grid resilience credits.
Community solar participation can complicate appraisal, as ownership vs. lease structures affect who bears benefits and how savings are demonstrated to buyers. Overall, appraisers emphasize market-tested payback indicators and enforce consistency with recognized appraisal standards.
Real-World ROI: Case Studies and Benchmarks
Real-world ROI isn’t guesswork or theory—it’s what verified projects, prices, and performance data show in practice. You’ll see benchmarks where net present value and payback periods cluster around 6–12 years, depending on incentives, system size, and local rates.
To put it succinctly, outcomes hinge on reliable installations, consistent production, and proper maintenance.
- Case-study contrasts reveal that higher-quality solar panel materials often reduce long-run degradation, boosting both output and resale appeal.
- Benchmark scans show installations with rigorous safety protocols, including electrical labeling and inverter protection, experience fewer outages and faster commissioning.
- Sensitivity analyses demonstrate that incentive timing and utility net metering rules materially shift ROI, sometimes by double-digit percentage points.
A Quick Framework to Decide Your Move
To decide whether to install solar, start with a simple framework: quantify goals, assess costs and incentives, and map them to your local rates and usage patterns. You’ll build a decision model by weighing preferred outcomes against practical constraints.
Define target payback, depth of emissions reduction, and resilience needs, then translate those into measurable metrics.
Compare Solar panel materials for durability, efficiency, and warranty, against upfront and ongoing costs.
Evaluate Installation techniques for system reliability and maintenance implications, including rooftop vs ground mounting, inverters, and monitoring.
Factor incentives, tax credits, and net metering rates in your region, adjusting for load shape.
Use historical weather, tariff data, and projected rate trends to stress-test scenarios.
The result is a transparent, data-driven path from goal to action.
Frequently Asked Questions
How Long Until Solar Pays Back Aside From Savings?
Solar pays back roughly 7–12 years, depending on location and incentives. You’ll quantify Environmental impact and Installation costs with data: panel efficiency, maintenance, and energy pricing. You’ll consider demand shifts, depreciation, and system lifespan for a pragmatic view.
Do All States Offer the Same Incentives Today?
Not exactly; state incentives vary. You’ll encounter differing solar policies across states, so you’ll need to research current programs. State incentives, solar policies, aside from federal credits, differ by rebate structures, tax credits, and net metering rules. Check, compare, act.
Can Solar Increase Property Taxes or Insurance Costs?
Solar installations typically don’t raise property taxes in most jurisdictions, but tax incentives may shift assessments; insurance costs may adjust modestly. Tax implications vary by location, policy, and system value, while insurance adjustments depend on risk and provider specifics.
Which Roof Types Are Unsuitable for Solar Installation?
You’re thinking of roofs that won’t host solar, like highly textured or irregular surfaces; you’ll encounter unsuitable roof types. Roof material and shading issues prevent ideal performance, so verify structure, orientation, and daylight exposure before installation.
How Does Solar Affect Home Resale Timing?
Solar affects home resale timing by potentially accelerating offers if buyers value energy efficiency; you’ll see faster demand when solar panel durability is proven and installation costs are clearly offset by ongoing savings and tax incentives.
Conclusion
You’ll weigh up upfront costs against decades of savings, like budgeting sunlight into your future. The data say solar boosts home value, trims utility bills, and shields you from rising rates—especially with incentives and smart financing. Yet the math isn’t magical; it’s meticulous, driven by panels’ output, permitting, and local incentives. If the numbers pencil out, the system becomes a steadfast engine for wealth, resilience, and predictability—turning a sunny investment into lasting financial weather protection.